-
- December 12, 2024
- 0
The Fosback High-Low Indicator
If you want to be reminded about how many, widely varying varieties of dinosaurs existed, you can ask any eight-year-old. Similarly, there are many “dinosaur” investing signals that have survived for a long time. Today we will examine another one.
In 1976, Norman Fosback wrote the book, “Stock Market Logic: A Sophisticated Approach to Profits on Wall Street”. In it he introduced the High Low Logic Index. To construct it, we find the number of New York Stock Exchange (NYSE) stocks that are making new one-year highs and one-year lows. Then, we take the minimum of that number and divide by the total number of stocks. So, a low value means stocks are in a range and a high value means that stocks are moving into a new regime.
The rationale is further explained by the inventor: “Under normal conditions, either a substantial number of stocks establish new annual highs or a large number set new lows – but not both. As the Logic Index is the lesser of the two percentages, high readings are therefore difficult to achieve. When the Index attains a new high level, it indicates that the market is undergoing a period of extreme divergence – many stocks establishing new highs and many setting new lows as well. Such divergence is not usually conducive to future rising stock prices…Many new highs and very few lows is obviously bullish, but so is a great many new lows accompanied by few or no new highs.”
The idea works. The Index negatively correlates with one-day forward returns. And, just as with the variance risk premium, the effect is present across different sub-periods.
Date Range
Fosback H-L Index/Return Correlation 1995-1999
-0.027
2000-2004
-0.053
2005-2009
-0.031
2010-2014
-0.020
2015-2019
-0.052
2020-2024 -0.030
Table 1: Yahoo! Finance (2024) Historical Price Data
As we stated in a previous blog, a signal isn’t a strategy. But if we solely use the Fosback Index as a signal and build a hypothetical strategy to match the volatility of the S&P 500, we get these results from January 2016 to October 2024:
Statistic
Strategy Benchmark
Compound Annual Growth Rate
16.09% 14.74% Volatility
17.89% 17.96% Sharpe
0.78 0.70
Sortino
1.31
1.20
Max Drawdown 31.60% 33.70%
Table 2: Yahoo Finance! (2024) Historical Price Data. The Hypothetical results above do not represent actual performance, was not achieved by any investor, and actual results may vary.
Below are hypothetical results using the Fosback Index plotted as a growth of a dollar from inception:
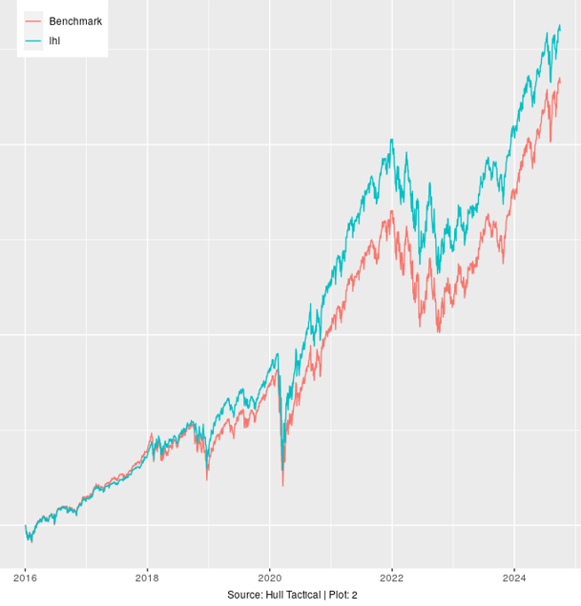
Note: The values in the above Plot 2 represent an initial investment of $1 since January 1st, 2016 using the Fosback Index. The signal performance does not represent actual performance and assumes no transaction costs. This performance was no achieved by any investor, and actual results may vary.
Both the strength of this signal (measured by the forward correlation) and the amount of alpha it delivers are small. The same was true when we used the VRP as a signal. This weakness is a feature, not a bug. We emphasized in the post, “Small Edges Add Up“, that a robust strategy almost has to be based on many weak signals rather than a single unicorn strategy. The last two posts have shown how weak signals can persist for decades, even after being widely disseminated.
Dinosaurs exist. Unicorns never have.
Disclaimer
This document does not constitute advice or a recommendation or offer to sell or a solicitation to deal in any security or financial product. It is provided for information purposes only and on the understanding that the recipient has sufficient knowledge and experience to be able to understand and make their own evaluation of the proposals and services described herein, any risks associated therewith and any related legal, tax, accounting, or other material considerations. To the extent that the reader has any questions regarding the applicability of any specific issue discussed above to their specific portfolio or situation, prospective investors are encouraged to contact HTAA or consult with the professional advisor of their choosing.
Except where otherwise indicated, the information contained in this article is based on matters as they exist as of the date of preparation of such material and not as of the date of distribution of any future date. Recipients should not rely on this material in making any future investment decision.
The S&P 500® Index is designed to measure the performance of the large-cap segment of the US equity market. It is float-adjusted market capitalization weighted.
LEAVE A COMMENT