-
- February 28, 2017
- 0
Got Gamma?
In the 1966 Harvard Business Review article “Can Mutual Funds Outguess the Market” Jack Treynor and Kay Mazuy proposed a metric to determine whether mutual fund managers have market timing ability. The authors’ key insight was phrased as a question: “Is there evidence that the volatility of the fund was higher in years when the market did well than in years when the market did badly?” When times are good, fund managers will load up on stocks, according to this idea. In anticipation of a poor market, they will cut back. As a result, funds that display evidence of good market timing will be more volatile in up markets and less volatile in down markets.
Explaining further, the authors said:
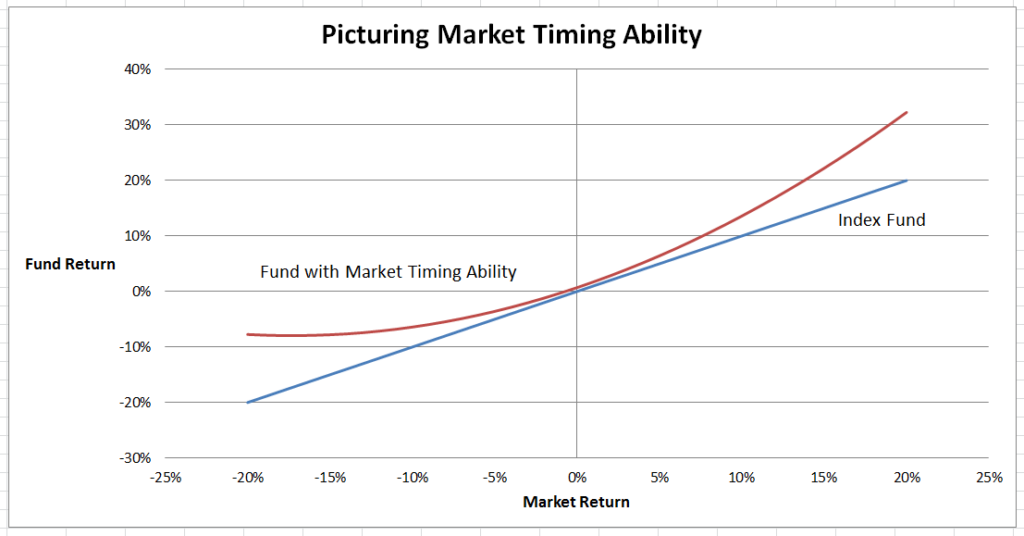
Let us assume that management has some prediction powers. Then, the better the market performs, the more likely management is to have anticipated good performance and to have increased the fund volatility appropriately; and the larger, on the average, the chosen volatility is likely to be. The result will be a gradual transition of fund volatility from a flat slope at the extreme left to a steep slope at the extreme right, with the slope varying more or less continuously in between, producing a smoothly curved characteristic line pattern. The only way in which fund management can translate ability to outguess the market into a benefit to the shareholder is to vary the fund volatility systematically in such a fashion that the resulting characteristic line is concave upward.
A final insight from the authors (for the more mathematically inclined): “A least squares statistical fit of the characteristic line to the performance data for the fund will be improved by inclusion of a quadratic term in the fitting formula.”
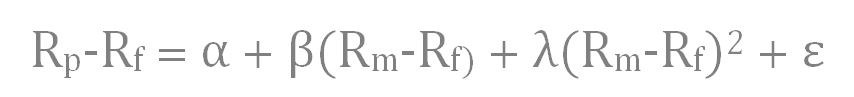
Given the discussion above, how does one actually measure market timing ability? According to the Treynor-Mazuy formula, we start with a linear regression of fund excess returns against market excess returns. Excess returns are the actual returns on the fund or market, less the risk free interest rate. The regression alpha indicates stock selection ability. If the alpha is positive, the manager is adding value (and just the opposite if the alpha is negative). The beta coefficient measures “riskiness” compared to the market. A beta of one means the fund is in line with the market; less than one indicates less risk; more than one indicates more risk.
In order to estimate the curvature of a market timer’s characteristic line, a third quadratic term – the square of market excess returns — is added to the regression equation. If the third “gamma” coefficient is statistically significant then the manager has displayed market timing ability.
How does our strategy stack up according to the Treynor-Mazuy measure? From inception in June 2015 to date, the alpha was not distinguishable from zero. This is to be expected since stock selection is not a part of the strategy. The beta was 0.17, meaning that on average, the strategy has taken on less risk than the market. Finally, the gamma coefficient was a positive 2.32 (p<0.01), meaning there is less than a one percent probability that the market timing ability displayed was due to chance.
A second test was run with a start date of November 2015, when we began to incorporate shorter term models into the strategy. The output showed a gamma coefficient of 7.14 (p<0.001). The probability of a chance display of market timing was less than one-tenth of a percent over that period.
Meanwhile, the research effort continues. We are working on both existing and new models. At some point this year we may begin trading new instruments.
LEAVE A COMMENT