-
- April 15, 2025
- 0
The Holiday Effect
“Calendar anomalies” are the excess market returns that are tied to certain time of the year. Some examples are the January Effect, the Turn-of-the-Month effect, the Halloween Effect and the Moon-Phase effect. Calendar effects are probably the easiest anomalies to trade as they require nothing more than an email alert or even an old-fashioned physical calendar. The process is as simple as “it is three days before the new month, so I’d better buy some S&P 500”.
But there are some important weaknesses to be aware of. First, you will never have much data. For example, the FOMC only meets ten times a year. Even 50 years of FED days will only generate 500 or so data points, which is insignificant when compared to the total trading days of about 12,600. And if we (correctly) note that the market’s response to FOMC announcements varies over time, then our effective signal becomes even smaller.
Next, there is a practically infinite number of things you could test. And you will absolutely find some patterns. And many of these patterns will pass basic statistical tests. For example, let’s say every Tuesday over the last two months had a positive return. Over the last 20 years, about 55% of days have positive returns. It’s easy to conclude that the chance of eight consecutive, positive Tuesdays is 0.45^8 or about 0.16%. But this result is far less impressive if you realize that the same probability would apply to the returns of any random group of eight days. Because the days we looked at were all Tuesdays, we thought the patterns must be real. We wouldn’t draw any conclusion from almost all the possible patterns.
Don’t start looking for calendar anomalies in the data. It is good advice in general to not start anything by sifting through data. Start with a sensible hypothesis and then see if it makes sense. Anomalies are, by definition, unusual. There needs to be something fundamentally “different” about the periods you are looking at. What’s special about the last eight Tuesdays? Probably nothing, so you can ignore the statistics and move on.
But having said all that, there are times when periods that are clearly abnormal have excess returns that are statistically significant. One of these is the “holiday effect”: US stock markets tend to go up before holidays. Since 2005, the three days before stock market holidays (currently New Years Day, MLK Day, Presidents Day, Good Friday, Memorial Day, Juneteenth, July 4th, Labor Day, Thanksgiving and Christmas) have average returns four times larger than the unconditional average. And this pattern has been remarkably consistent.
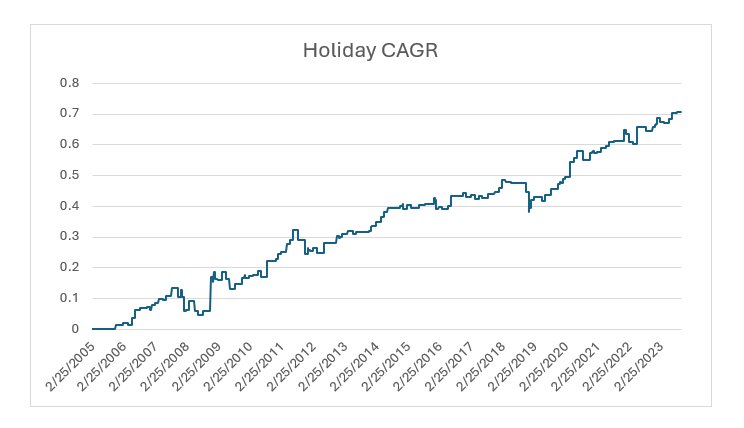
Forty percent of the total market return came from the 10% of days leading into holidays.
The question for you to ponder is how much you believe in this. Holidays are clearly “different”, and the statistics are compelling. But it certainly could be luck. I’ve seen baseball hitters go four for four, but I’d still bet that their career average would be under 0.350. Evidence is always nuanced and even the most systematic investors need to use discretion to decide what to include in the system.
The best solution to this conundrum is to have a composite model. If an ensemble of 30 features contains 5 that are useless, that isn’t much of a problem. And as there aren’t any 100% reliable signals, this approach is probably the only one with a chance of succeeding.
Happy holidays everyone!
Disclaimer
This document does not constitute advice or a recommendation or offer to sell or a solicitation to deal in any security or financial product. It is provided for information purposes only and on the understanding that the recipient has sufficient knowledge and experience to be able to understand and make their own evaluation of the proposals and services described herein, any risks associated therewith and any related legal, tax, accounting, or other material considerations. To the extent that the reader has any questions regarding the applicability of any specific issue discussed above to their specific portfolio or situation, prospective investors are encouraged to contact HTAA or consult with the professional advisor of their choosing.
Except where otherwise indicated, the information contained in this article is based on matters as they exist as of the date of preparation of such material and not as of the date of distribution of any future date. Recipients should not rely on this material in making any future investment decision.
The S&P 500® Index is designed to measure the performance of the large-cap segment of the US equity market. It is float-adjusted market capitalization weighted.
LEAVE A COMMENT