-
- March 6, 2025
- 0
Consumer Sentiment
We have written before about how overconfidence is a terrible bias for an investor to have. To be fair, it kind of has to be by definition. If it wasn’t a bad thing it wouldn’t be called overconfidence, it would just be confidence. But does the aggregate confidence of consumers matter? Specifically, does confidence in the economy predict stock market returns?
One way we can test this is to use the University of Michigan Sentiment Index. This is a measure of consumer confidence published monthly since 1978 (quarterly since 1966). A telephone survey of at least 500 people asks 50 questions about their own financial situation and their views on the economy. There are obvious objections that could be raised. Who has telephones these days? Does that make the survey biased? Are 500 consumers enough? Are the questions good? While these are valid, the index is a measure of consumer confidence even if it isn’t the perfect one. There is nothing to stop us seeing if it contains a signal.
Our data source was “Surveys of Consumers, University of Michigan, University of Michigan: Consumer Sentiment © [UMCSENT], retrieved from FRED, Federal Reserve Bank of St. Louis, (Accessed on 2/20/2025)”. The time series looks like this:
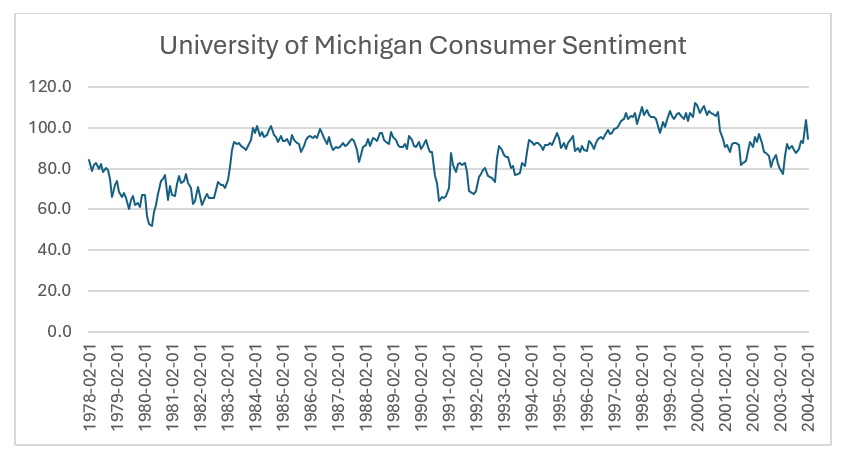
Even without the benefit of fancy, book-learnin’ statistics, it seems reasonably clear that the series has no long-term trend (and it was designed this way). So, we can sensibly see how levels of the index correspond to subsequent S&P 500 returns. And it seems like the short answer is, “they don’t”. We split the University of Michigan Index levels into deciles and calculate the market return over the next month. The next picture shows the average (annualized) returns.
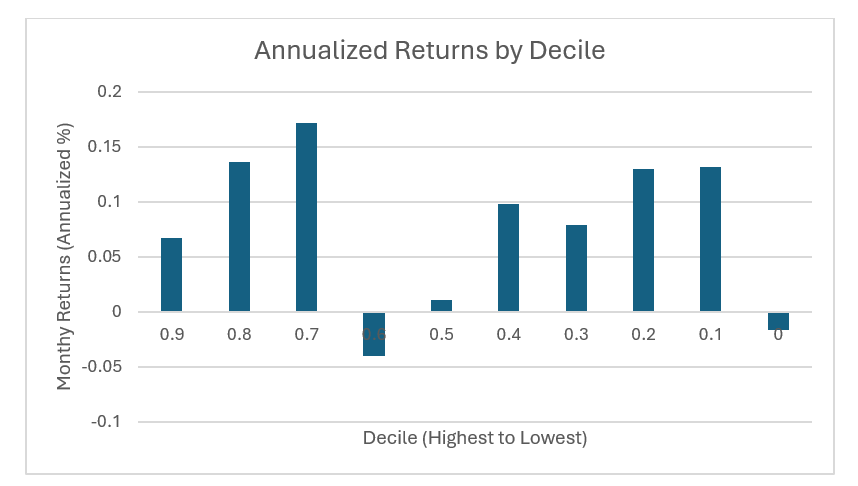
There isn’t much of a pattern there.
But if we look at the monthly (percentage) changes in the Index, we do see something.
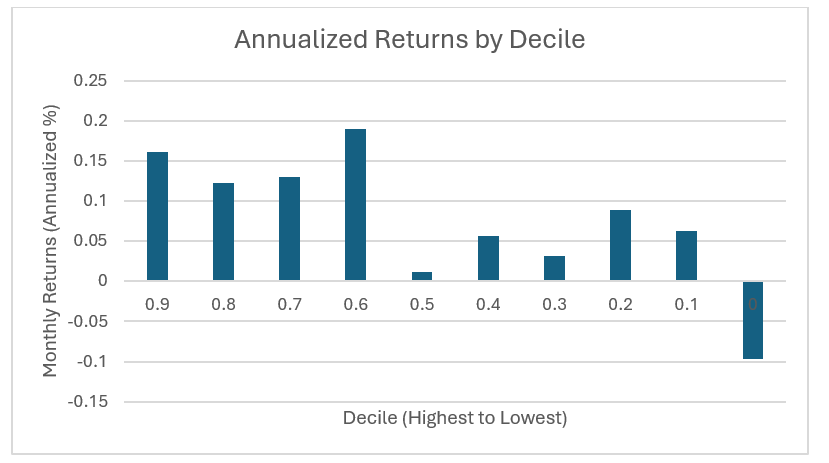
Higher changes in consumer confidence portend higher stock returns.
We can take this observation and make it even more robust by splitting returns into the times when the Index went up and when it went down. Since 1978 the summary statistics for this idea are:
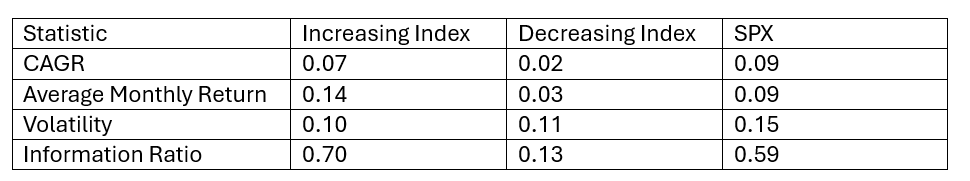
*SPX is the S&P 500 Index.
And the cumulative compound annual growth rate (CAGR) for the “increasing Index” rule is shown here:
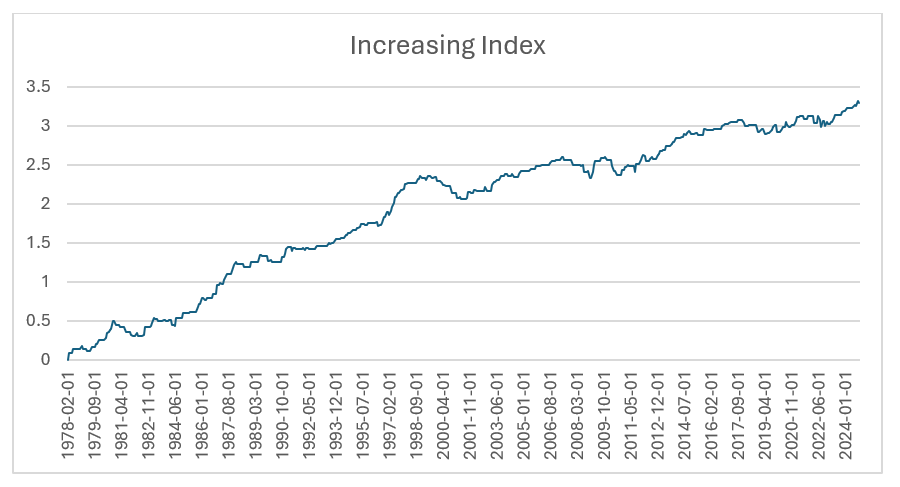
(and remember this strategy is in the market only about 48% of the time).
In summary, it seems like it doesn’t matter if people are confident or not, but it is a good sign if they are becoming more confident.
Disclaimer
This document does not constitute advice or a recommendation or offer to sell or a solicitation to deal in any security or financial product. It is provided for information purposes only and on the understanding that the recipient has sufficient knowledge and experience to be able to understand and make their own evaluation of the proposals and services described herein, any risks associated therewith and any related legal, tax, accounting, or other material considerations. To the extent that the reader has any questions regarding the applicability of any specific issue discussed above to their specific portfolio or situation, prospective investors are encouraged to contact HTAA or consult with the professional advisor of their choosing.
Except where otherwise indicated, the information contained in this article is based on matters as they exist as of the date of preparation of such material and not as of the date of distribution of any future date. Recipients should not rely on this material in making any future investment decision.
The S&P 500® Index is designed to measure the performance of the large-cap segment of the US equity market. It is float-adjusted market capitalization weighted.
Published by the University of Michigan, the Michigan Consumer Sentiment Index (MCSI) is a monthly survey based on interviews that measure US consumer attitudes towards personal finances, business conditions and economic activity.
LEAVE A COMMENT