-
- January 15, 2025
- 0
Don’t Just Sell Volatility
“Nowadays people know the price of everything and the value of nothing.” – Oscar Wilde, The Picture of Dorian Gray
There is a very good reason why you should not invest in funds that always sell volatility, no matter the level.
Volatility sellers have enormous drawdowns. In the first full week of February 2018, volatility sellers lost a lot of money. Funds using VIX ETNs lost up to 90%. Funds that sold index options lost up to 40%. The mathematics of compounding make drawdowns particularly horrible. At fist glance you might guess that a fund that has lost 40% needs to make 40% to get back to even. This is not true. The loss drops assets under management (AUM) to 60% of the original value, so to get back to 100% we need a subsequent 67% return. For most volatility funds, this will take 3-5 years.
You should have exposure to volatility, but it should be active exposure.
Volatility is forecastable. A search of SSRN (the social science research network) for “volatility forecasting” gave 1849 results: papers that contained detailed studies of volatility prediction methods.
Even a weak forecast can significantly improve results. Here is an example applied to VPD. This is a CBOE strategy index which combines a money market account with short front month VIX futures position (details can be found a https://www.cboe.com/us/indices/dashboard/vpd/). While it isn’t the only short volatility strategy, it shares the distributional characteristics of most short volatility strategies: high returns and high drawdowns.
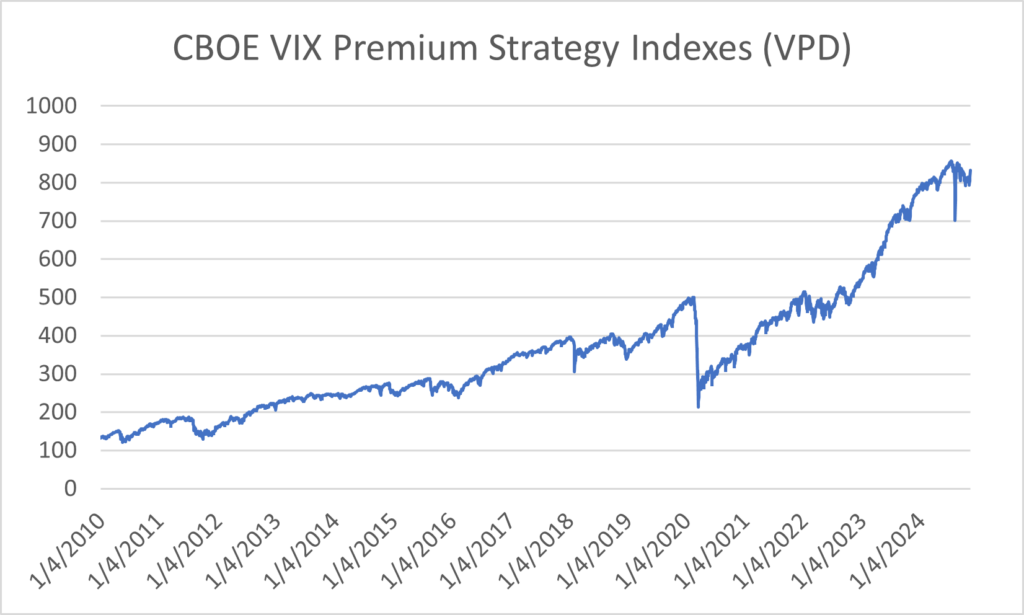
Here is the performance of VPD from 2010.

The compound annual growth rate (CAGR) has been 12.3% and the annualized volatility has been 23.4%. Unfortunately, the maximum drawdown was 57.4%, and it took nearly two years to recover.
A very simple forecasting rule can improve these drawdowns.
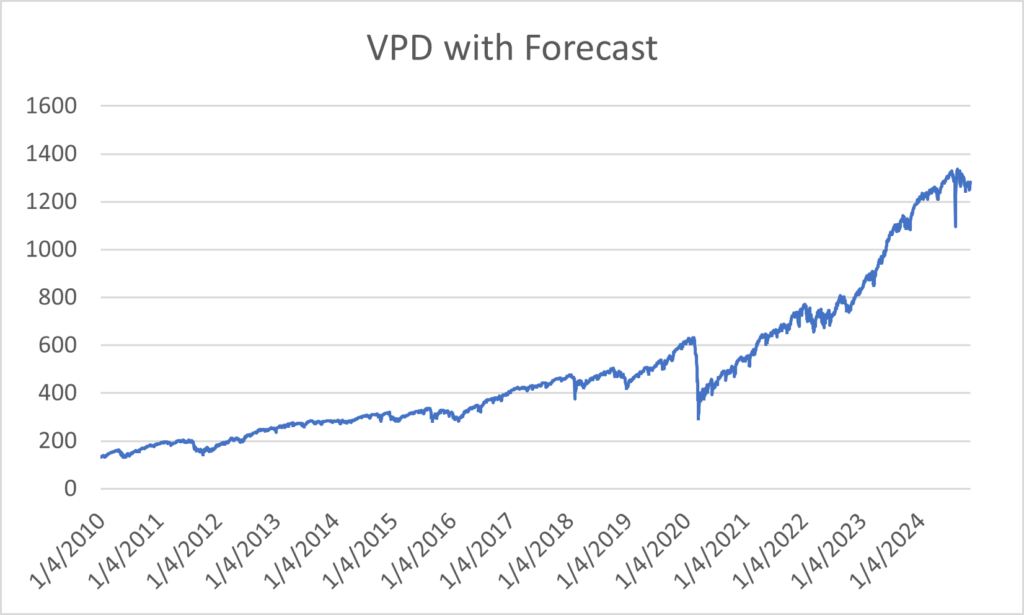
VIX futures are unusual. Standard economic thinking tells us that a future price should be an unbiased predictor of the underlying price when the contract expires. This is untrue for VIX futures. Instead, the futures tend to move towards the VIX index. Generalizing this effect, the term structure of the implied volatility curve predicts the direction of the front-month futures. In particular, if the 3-month VIX (VIX3M) is far enough above the VIX, we expect VPD to be profitable. Our rule is that if VIX3M is above the VIX, we short front month VIX futures, and if VIV3M is below the VIX we are long futures. The results of this strategy are shown here.

CAGR has increased to 15.5% and annualized volatility is 22.5%. The maximum drawdown is now 53%. A trivial classification-based forecast has improved the Sharpe ratio by nearly a third.
There are few businesses that succeed by selling a product regardless of the price. But that is exactly the service that most option ETFs provide. And charging a fee to do so. Volatility is special in that it is a tradeable asset that can be predicted. To trade it without bothering to make any prediction seems absurd. And we show here that even an exceptionally simple forecasting model adds value. Imagine what is possible if one were to read one of the 1849 papers on SSRN.
No idea or option structure is so special that it will make money all the time, regardless of price. But you don’t need to do that with volatility. So why would you? Or worse, why would you pay someone else to do so?
Disclaimer
This document does not constitute advice or a recommendation or offer to sell or a solicitation to deal in any security or financial product. It is provided for information purposes only and on the understanding that the recipient has sufficient knowledge and experience to be able to understand and make their own evaluation of the proposals and services described herein, any risks associated therewith and any related legal, tax, accounting, or other material considerations. To the extent that the reader has any questions regarding the applicability of any specific issue discussed above to their specific portfolio or situation, prospective investors are encouraged to contact HTAA or consult with the professional advisor of their choosing.
Except where otherwise indicated, the information contained in this article is based on matters as they exist as of the date of preparation of such material and not as of the date of distribution of any future date. Recipients should not rely on this material in making any future investment decision.
The S&P 500® Index is designed to measure the performance of the large-cap segment of the US equity market. It is float-adjusted market capitalization weighted.
VIX futures contracts are futures contracts based on the Chicago Board of Options Exchange Volatility Index (the “VIX Index”). The VIX Index seeks to measure the market’s current expectation of 30-day volatility of the S&P 500® Index as reflected by the prices of near-term S&P 500® Index options.

LEAVE A COMMENT