-
- November 12, 2019
- 0
Yellow Flag (Re) Deux?

Over the past week our allocation to stocks has dropped from fully invested to 32%. That’s quite an abrupt change that deserves an explanation. Let’s compare the October 29 and November 7 reports in our Daily Report archive found at http://www.hulltactical.com/daily-reports/archives/.
The reports show that the Federal Reserve Bank Loan Officer Survey contribution to our Equity Risk Premium fell from plus 2.06% to minus 0.82%, a swing of 2.88 percentage points. In addition, the contribution from our inflation variable dropped 0.85%, while the Baltic Dry Index reduced our forecast by 0.65%. All told, the forecast fell from plus 3.74% to minus 0.52% over the past week.
Table 1 ERP Forecast Contributions by Variable in Percentage Points
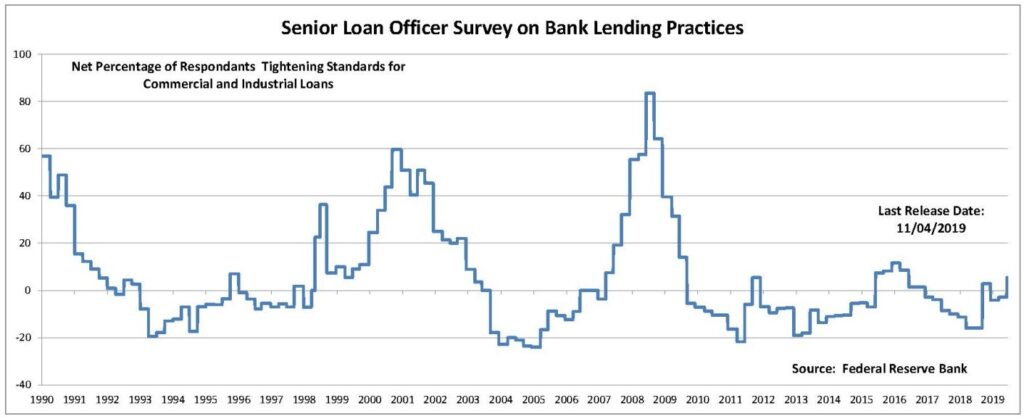
Variable October 29th November 7th Intercept 4.47 4.47 Baltic Dry Index -0.20 -0.85 FRB Loan Officer Survey 2.06 -0.82 Inflation 1.06 0.21 New Orders / Shipments 1.35 1.47 Valuation -5.00 -5.00 Totals 3.74 -0.52 Since the Loan Officer Survey contributed most to the swing, we prepared a chart going back to 1990 when the first such survey was released. The chart shows tightening into both the early 2000s recession and the great recession in 2008. Since then, there have been two false starts – the indicator rose to 5.4% in 2012 and 11.6% in 2016 and subsequently eased in both cases. Based on this indicator alone, we would become worried if it rose above its 2016 high and into the 15% to 20% range.
Chart 1 FRB Loan Officer Survey

As previously mentioned, however, the Baltic Dry Index has become more bearish and our measure of inflation has become less bullish, leaving our Equity Risk Premium forecast slightly negative at minus 0.52%. This brings to mind the “Yellow Flag” warning we published in September of last year. We observed then that when the equity risk premium forecast goes negative, subsequent returns, on average, are sub-par.
In last year’s post we looked at monthly averages of our daily ERP forecasts to get a sense of what a negative forecast means for the stock market. We looked at our forecasts going back to 2001, sorted the monthly averages from lowest to highest and divided the data in to five groups. Here are the results, updated to include more recent data:
Table 1 Average monthly forecasts by quintile and subsequent returns on the S&P 500
Next Month Next 3 Months Next 6 Months Quintile 1 -0.90% -2.66% 0.20% Quintile 2 0.27% 2.93% 5.67% Quintile 3 0.90% 3.29% 5.57% Quintile 4 0.77% 2.69% 3.71% Quintile 5 2.12% 3.98% 6.70% Quintile 1 represents forecasts in the bottom fifth of the group; Quintile 5, the top fifth. Broadly speaking, subsequent returns rise as average monthly forecasts rise.
Our current Equity Risk Premium forecast is at the bottom of Quintile 2 territory, not quite as low when as we published our Yellow Flag post in September 2018. But the forecasts bear watching. Will bank loan officers continue to tighten? We’ll find out in early February. In the meantime, the Baltic Dry Index is published daily while inflation and new orders/shipments information comes in monthly. The downside contribution from Valuation is capped at minus 5.0%, so that variable cannot get worse from the point of view of our model.
So our conclusion is pretty close to what we concluded in September of 2018. Conditions suggest that investors are currently being offered very little of the upside the stock market offers over the long run. We believe equity returns are likely to be below average, though not necessarily negative, in the coming months.
Readers with an interest in our daily forecasts and how we arrive at them may follow this link to our Daily Report.
©2019 Hull Tactical Asset Allocation, LLC (“HTAA”) is a Registered Investment Adviser.
The information set forth in HTAA’s market commentaries and writings are of a general nature and are provided solely for the use of HTAA, its clients and prospective clients. This information is not intended to be and does not constitute investment advice. These materials reflect the opinion of HTAA on the date of production and are subject to change at any time without notice. Due to various factors, including changing market conditions or tax laws, the content may no longer be reflective of current opinions or positions. Past performance does not guarantee future results. All investments are subject to risks. Where data or information is presented that was prepared by third parties, such information will be cited and any such third-party sources have been deemed to be reliable. However, HTAA does not warrant or independently verify the accuracy of such information.

LEAVE A COMMENT