-
- March 18, 2025
- 0
The Doomsday Clock
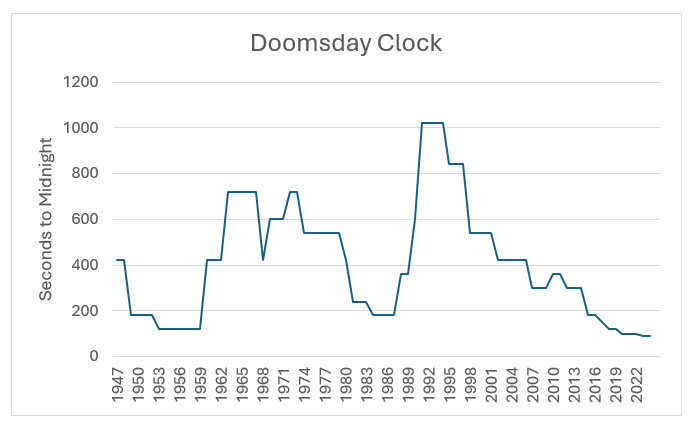
In 1947, the members of the Bulletin of the Atomic Scientists, a non-profit organization that has a general website and also publishes an academic journal, started the “Doomsday Clock”. This is a metaphorical measurement of how close the world is to a global, existential catastrophe caused by humans and their technologies. The idea came about out of concern over the invention of atomic weapons, but the measurement now also includes the threats of biotechnology, artificial intelligence, and climate change. The “time” of such a catastrophe is represented by midnight, with the Bulletin‘s opinion on how close the world is to one represented by a certain number of minutes or seconds to midnight.
The clock was initially set to seven minutes to midnight, and now stands at 89 seconds, the lowest ever reading. Obviously, these numbers aren’t literal but are meant to serve as a warning.
The idea of the clock has been criticized, ostensibly because the process is well defined but probably also because there are people who deny the idea that climate change in particular is a danger. But we accept the results of many undefined processes: anything involving humans voting for example. And plenty of people get very mad about the definition of inflation numbers, but they certainly affect the economy and markets. So, there is nothing stopping us looking for a link between the Doomsday Clock and markets. We know wars are bad for markets (something else that plenty of people want to ignore), so what about the threat of global annihilation?
From the website of the Bulletin, the Clock readings are:
The correlation in between changes in the Clock and subsequent changes in the S&P500 is about 6%. But the small sample size means this number has a 95% confidence interval of -17% to 29%. If we are being honest, the correlation is basically zero. If we look for patterns at lower granularity, we also see nothing very interesting. Splitting the data into both levels and changes of the Clock and looking at the average subsequent returns gives.
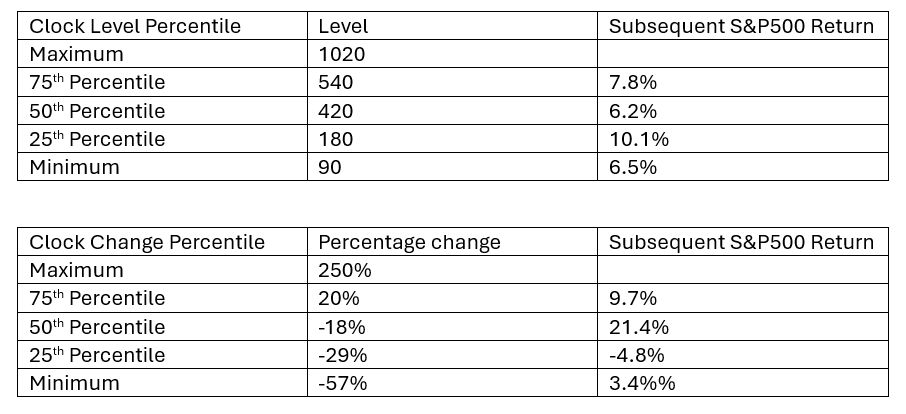
Again, there is no clear relationship between either levels or changes in the clock and the market’s performance. There is nothing intrinsically wrong with using small data sets. Often in finance that is all we have. But because we can’t rely of the law of large numbers, we need to see very clear patterns before we can sensibly draw conclusions.
Maybe this shouldn’t be surprising. It is likely that lot of people haven’t heard of the Clock and perhaps the things that drive the clock seem too “far away” from everyday concerns. Possibly markets are just bad at pricing in things that haven’t happened before. Or possibly (and rationally) people reason that if the world ends it won’t matter what was in their portfolios.
Disclaimer
This document does not constitute advice or a recommendation or offer to sell or a solicitation to deal in any security or financial product. It is provided for information purposes only and on the understanding that the recipient has sufficient knowledge and experience to be able to understand and make their own evaluation of the proposals and services described herein, any risks associated therewith and any related legal, tax, accounting, or other material considerations. To the extent that the reader has any questions regarding the applicability of any specific issue discussed above to their specific portfolio or situation, prospective investors are encouraged to contact HTAA or consult with the professional advisor of their choosing.
Except where otherwise indicated, the information contained in this article is based on matters as they exist as of the date of preparation of such material and not as of the date of distribution of any future date. Recipients should not rely on this material in making any future investment decision.
The S&P 500® Index is designed to measure the performance of the large-cap segment of the US equity market. It is float-adjusted market capitalization weighted.
LEAVE A COMMENT