-
- January 22, 2025
- 0
Patterns & “Patterns”
Review the following charts:
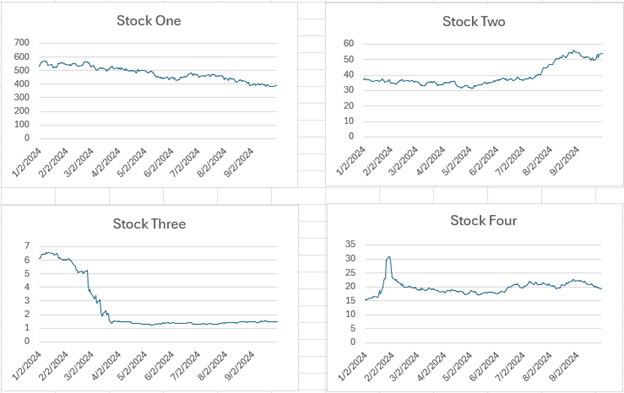
These are nice examples of a bear market, a bull market, a crash and a bursting bubble.
Except that isn’t true. Each price series is randomly generated. And they are all randomly generated using a normal distribution of returns with zero mean and the same volatility (I used different starting prices to make them seem realistic). If you run 10,000 simulations, a lot of patterns will appear. But they aren’t real. They are just particular instances of randomness.
Humans are very poor at identifying random patterns. Whenever we see patterns, we look for causes. If someone tossed a coin ten times and there was a streak of 6 heads, you would be suspicious that the coin wasn’t fair. But purely through chance, such a streak would happen about 5% of the time. The event wasn’t particularly unlikely, but we aren’t wired to see randomness.
Our tendency to see patterns where there are none is called the “clustering effect.”
Like most psychological biases, this comes about because we are still optimized to be running around the African savanna. Evolution had millions of years to get us to that point and only a few hundred thousand years since, so it makes sense that we haven’t grown out of the habits and skills that were necessary for survival then. And it was much better to think you saw a lion in some grass and be wrong than to miss seeing a real lion once. Failing safe makes sense. A more recent example was in World War II where the London newspapers published maps of where German rockets had landed. The strikes seemed to be clumped, so people assumed certain areas were being targeted and avoided these. Actually, the rockets were too inaccurate to aim like this and the clusters were the result of randomness.
When avoiding being eaten or bombed, reacting when you think you see a pattern makes sense. But it is very dangerous when it comes to investing. Mistaking randomness for signal will, at best, lead to over trading and over concentration. It will probably be worse. This is also one reason why traditional, pattern based technical analysis is so hard. In most cases, the practitioner is trying to find a pattern where there isn’t one. It isn’t a case of a needle in a haystack. It is a case where there is no needle.
The best way to be a good problem solver is to pick easy problems. And forecasting stock direction from price data is not easy. Most of the time, most stocks are mostly efficient. Looking at charts, even if it works, isn’t a good plan. The odds are against it, and investing is meant to be about putting the odds in your favor.
Luckily there are entire fields of mathematics designed to find small effects in noisy data: statistics, signal processing and time series analysis. And all of which can be augmented with machine learning. There are patterns in stock prices, but each one is far too small to trade on its own. And this causes a lot of wasted effort in arguments, for example about whether stocks trend or reverse. It is the traders’ version of children arguing about whether a boxer could beat a karate master. The only reason these arguments have persisted for decades is that both sides are right. Sometimes there are trends and sometimes there are reversals. But usually, either effect is small. And often there is nothing.
Trying to trade on one signal is almost certainly pointless. At best, you are making a hard process harder.
Disclaimer
This document does not constitute advice or a recommendation or offer to sell or a solicitation to deal in any security or financial product. It is provided for information purposes only and on the understanding that the recipient has sufficient knowledge and experience to be able to understand and make their own evaluation of the proposals and services described herein, any risks associated therewith and any related legal, tax, accounting, or other material considerations. To the extent that the reader has any questions regarding the applicability of any specific issue discussed above to their specific portfolio or situation, prospective investors are encouraged to contact HTAA or consult with the professional advisor of their choosing.
Except where otherwise indicated, the information contained in this article is based on matters as they exist as of the date of preparation of such material and not as of the date of distribution of any future date. Recipients should not rely on this material in making any future investment decision.
LEAVE A COMMENT