-
- December 5, 2024
- 0
The Variance Risk Premium
It is common to write off old ideas as “dinosaurs”. The implication is that they worked in the past but have now died off. But this superficially smart dismissal misses a very important point: the dinosaurs were incredibly successful. They dominated the planet for over 150 million years and are still around in the form of birds. There are over twice as many species of birds as there are of mammals. And before we humans get too cocky, we should remember than hominids have only existed for a few million years.
So, over the next few posts, we will be looking at a couple of very old ideas: using the volatility risk premium (VRP) and the Fosback High-Low indicator.
The idea that the variance risk premium is predictive of future market returns seems to date to the 2005 paper “Implied Volatility and Market Timing”, by Stan Beckers and Tom Bouten, but similar concepts had been floating around for decades. For example, Marty Zweig’s put-call ratio is a related idea, and this was published in 1983.
The VRP is defined as the difference between the option’s implied volatility and the realized volatility of the underlying. This is ambiguous for several reasons. First, there are usually lots of options on a given underlying and they will all have a different implied volatility. You can choose whatever you like, but usual choices are to use a fixed maturity at-the-money implied volatility (derived by interpolating between two listed expiries), or else the model-free implied volatility like the VIX. Then you calculate the corresponding maturing volatility of the underlying. But there are many ways to calculate realized volatility (close-to-close, Parkinson, Garman-Klass, etc.). And finally, the number you really want is what the volatility will be over the time-period covered by the options, but obviously you don’t know the future so you either need to forecast volatility or else to assume that it will be what it was in the past. So, when someone refers to the VRP it is beneficial to get clarification on exactly what they mean.
The general idea is that a high VRP is indicative of positive future stock returns. A high VRP indicates a high demand for options. This means people are avoiding risk. Hence, the stock market needs to offer higher prospective returns to entice buyers.
The idea works. If we define the VRP for SPY as the VIX minus the 21-day close-to-close volatility, we see that the number correlates positively with the one-day forward returns. And, importantly, the effect is present across different sub-periods.
Date Range VRP/Return Correlation 1995-1999 0.061 2000-2004 0.000 2005-2009 0.085 2010-2014 0.069 2015-2019 0.077 2020-2024 0.100 Table 1: Yahoo! Finance (2024) Historical Price Data
A signal isn’t a strategy, and we will go into how to take this step in a later post. For now, just accept that if we use the VRP as a signal and build a strategy to match the volatility of the S&P 500 we get these results from 2016 onwards:
Statistic
Strategy Benchmark
CAGR
15.87% 14.74%
Volatility
17.71% 17.96%
Sharpe
0.78 0.70
Sortino
1.34 1.20
Max Drawdown
28.13% 33.70%
Table 2: Yahoo Finance! (2024) Historical Price Data. The Hypothetical results above do not represent actual performance, was not achieved by any investor, and actual results may vary substantially.
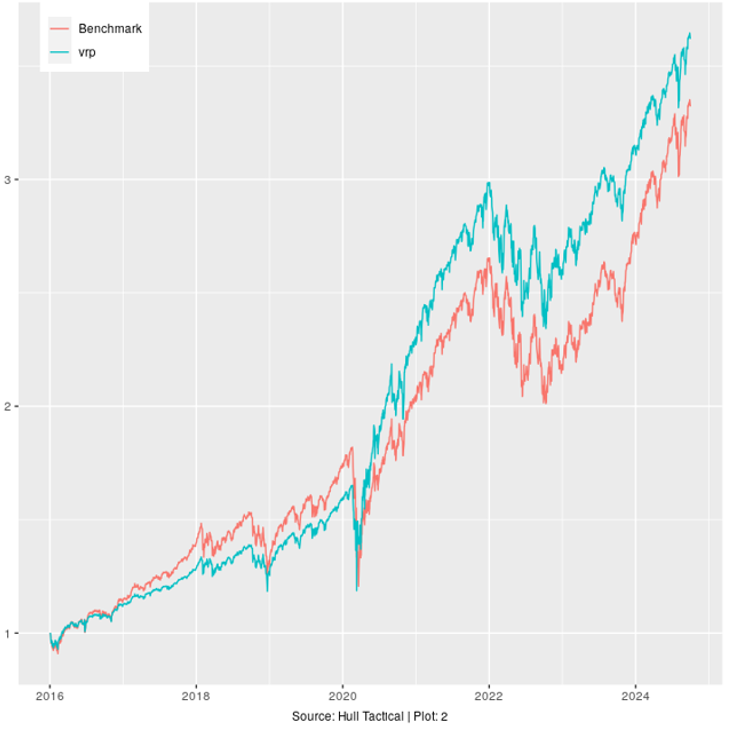
Note: The values in the above Plot 2 represent an initial investment of $1 since January 1, 2016 using the Volatility Risk Premium signal. The signal performance does not represent actual performance, and actual results may vary substantially.
The VRP is one of the signals in our model, but it still works on its own. The dinosaur is still alive.
Disclaimer
This document does not constitute advice or a recommendation or offer to sell or a solicitation to deal in any security or financial product. It is provided for information purposes only and on the understanding that the recipient has sufficient knowledge and experience to be able to understand and make their own evaluation of the proposals and services described herein, any risks associated therewith and any related legal, tax, accounting, or other material considerations. To the extent that the reader has any questions regarding the applicability of any specific issue discussed above to their specific portfolio or situation, prospective investors are encouraged to contact HTAA or consult with the professional advisor of their choosing.
Except where otherwise indicated, the information contained in this article is based on matters as they exist as of the date of preparation of such material and not as of the date of distribution of any future date. Recipients should not rely on this material in making any future investment decision.
The Chicago Board of Options Exchange volatility Index (the “VIX Index”) seeks to measure the market’s current expectation of 30-day volatility of the S&P 500 Index as reflected by the prices of near-term S&P 500 Index options.
The S&P 500® Index is designed to measure the performance of the large-cap segment of the US equity market. It is float-adjusted market capitalization weighted.
LEAVE A COMMENT