-
- June 12, 2024
- 0
New Orders

Durable goods are, almost by definition, things that we expect to last for a long time. They are a substantial investment, and the purchase is usually a significant, considered expenditure. According to mainstream economics, a business invests in durable goods based on the expected value of the future profits generated by the goods. But because business prospects are cyclical, by the time a business owner has decided to buy a new bulldozer, it is likely that we are nearing an economic peak. So durable purchases will be negatively correlated to future stock market returns.
(This argument is much weaker when applied to household spending. Households tend to buy things when they need them rather than as the result of any discounted cash flow valuation. Fridges don’t generate dividends, but they are useful to have in the kitchen.)
The idea that spending on durable goods could predict the stock market was first tested by John Cochrane (1991) and it seemed to be true, but weak.
Although the theory seemed to be overstating the true effect, the idea that big purchases could be predictive of the equity market was so appealing that researchers thought more carefully about what was going on and what the real signal could be. And the mistake that the economists had made was one that investing researchers also commonly make. They were looking at non-contemporaneous data. It didn’t matter when companies were taking deliveries of durable goods. What mattered was when they placed the orders. The order was placed at the time when the business owner was optimistic, but the item would often not arrive until much later, potentially when economic conditions had already begun deteriorating. It takes a long time to build a bulldozer.
Jones and Tuzel (2013) looked at the ratio of new orders to the amount of orders in the shipping pipeline. They showed that this ratio took its highest values at stock market peaks, and hence was a market-timing contra-indicator. It was similarly predictive for bonds. They found that a one standard deviation decrease in the log ratio of new orders to shipped orders implied a one-year excess return of 5.4% in the value-weighted (from 1958 to 2009). The CRSP value-weighted index is a broad market index from the Center for Research in Security Prices.
(The fact that interest rates, interest rate changes and the interest rate term structure are other inputs into our composite model is a good illustration of a point we made in the blog post, “Small Edges Add Up.” A lot of the skill in assembling a predictive model for the market is in accounting for the time varying correlations between the individual signals. You can’t just add them up.)
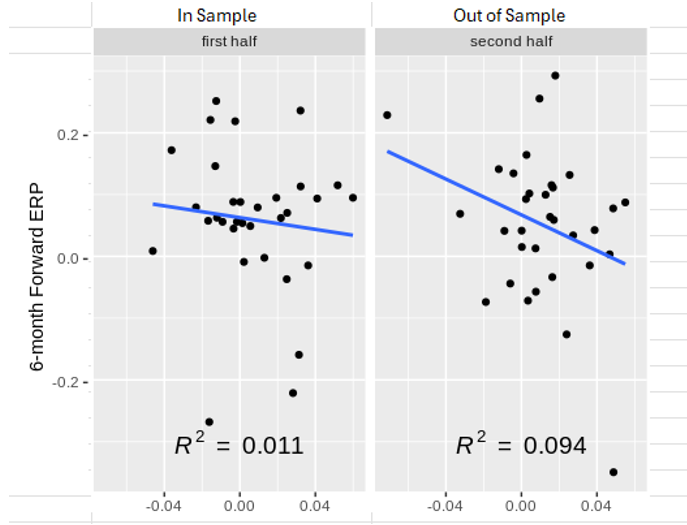
This isn’t a well-known indicator, and it isn’t particularly strong on its own (most things aren’t), but it has held up out of sample. It has actually improved out of sample. Here is the regression of the signal (x-axis) on subsequent S&P 500 returns (y-axis) both in-sample and out-of-sample (2013-2024) (from our in-house data and research.)

(In the table above, Equity Risk Premium (ERP) is an excess returned earned by an investor when they invest in the stock market over a risk-free rate. R2 is a measure of how much of a dependent variable can be explained by the independent variable(s). It is worth noting that R2 isn’t the definitive statistic for showing the efficacy of a signal, but equally it is not irrelevant. In almost any measurement, an ensemble of statistics will be more useful than just one.)
It is a common misconception that this type of data can only be used to predict long-term returns. But this isn’t true. It would take a very irrational price path for the market to be up after six months and not also up for a lot of days between now and then. Fundamental information is very useful.
Don’t be dogmatic. Use what works.
Disclaimer
This document does not constitute advice or a recommendation or offer to sell or a solicitation to deal in any security or financial product. It is provided for information purposes only and on the understanding that the recipient has sufficient knowledge and experience to be able to understand and make their own evaluation of the proposals and services described herein, any risks associated therewith and any related legal, tax, accounting, or other material considerations. To the extent that the reader has any questions regarding the applicability of any specific issue discussed above to their specific portfolio or situation, prospective investors are encouraged to contact HTAA or consult with the professional advisor of their choosing.

LEAVE A COMMENT